Fluffy is an all-in-one internal analytics platform I built and deployed for Feeding San Diego.
The organization needed a way to surface distribution trends, fulfillment KPIs, and ad-hoc reporting
without relying on manual exports — so I built it from scratch, deployed it to the cloud, and handed
off a tool the team could actually use.
3
integrated analytics tools
P/P
period-over-period variance tracking
NLP
natural language search engine
- Deployed a Python web app on Google Cloud Run with KPI dashboards, automated reports, and user authentication
- Engineered a pandas + Plotly pipeline to analyze order trends, fulfillment activity, and period-over-period variance
- Built a natural language search tool with custom tokenization to retrieve distribution and reporting metrics
- Modeled throughput, inventory cycle times, and efficiency to forecast capacity needs for warehouse expansion
Python
Pandas
Plotly
Streamlit
Google Cloud Run
NLP
Lumnus is a student-run for-profit consulting group at UCSD. With limited consultant bandwidth
and a growing project pipeline, the team needed a systematic way to evaluate which engagements
to take on. My team built a weighted decision matrix that quantified tradeoffs across eight dimensions
so leadership could make consistent, defensible capacity decisions.
8
weighted scoring dimensions
Org-wide
adopted as standard framework
- Designed a multi-variable scoring matrix weighing client value, consultant growth, pay, effort, time, cost, complexity, and strategic fit
- Built configurable weightings so leadership could adjust priorities based on organizational goals each semester
- Implemented a feedback and analysis framework to capture post-project learnings and refine future scoring
- Applied the model to a competitive landscape assessment for NanoMood's remote Ketamine monitoring platform
Excel
Decision Modeling
Operations Strategy
Consulting
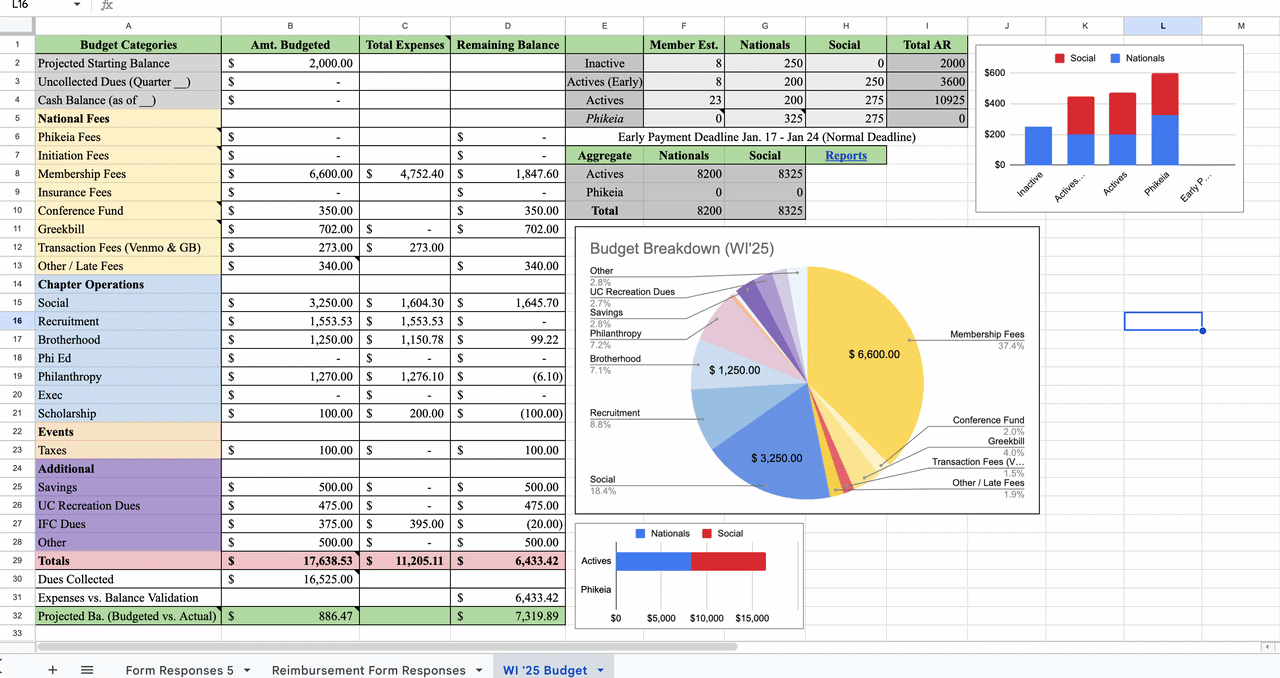
When I took office as Chapter Treasuer (and later Chapter President) I inherited a $5,000 deficit with no financial
documentation or formal budgeting process. I built a structured Excel model to stabilize the chapter's
finances, map a debt recovery path, and create a reusable framework for future treasurers.
$5K+
deficit resolved in-term
$23K
quarterly budget managed
~40
members financially represented
- Modeled a quarterly budget with built-in reimbursement workflows and variance tracking against actuals
- Forecasted multi-quarter recovery path to resolve $5,000+ in inherited deficits while maintaining operations
- Standardized reimbursement documentation to reduce treasurer onboarding time and processing errors
- Built growth goal scenarios to guide chapter expansion planning and long-term financial stability
Excel
Financial Modeling
Forecasting
Budget Management
Purchase order creation at Hologic was slow and error-prone due to fragmented supplier data
across Oracle ERP, Agile PLM, and manual spreadsheets. I built a centralized supplier-item
database linking materials, vendors, and catalog numbers to support automated MRP workflows
and significantly cut PO creation time.
1,500+
materials catalogued
80%
reduction in PO creation time
Oracle
ERP + Agile PLM integrated
- Built supplier-item database linking 1,500+ materials, vendors, and catalog numbers across procurement systems
- Validated Oracle Agile PLM master data for 1,500+ items against purchasing, compliance, and receiving requirements
- Redesigned risk assessment Excel calculator to identify production risks and support supply continuity planning
- Standardized buyer documentation to support automated MRP purchase order workflows
Excel
Oracle ERP
Agile PLM
Data Modeling
Supply Chain